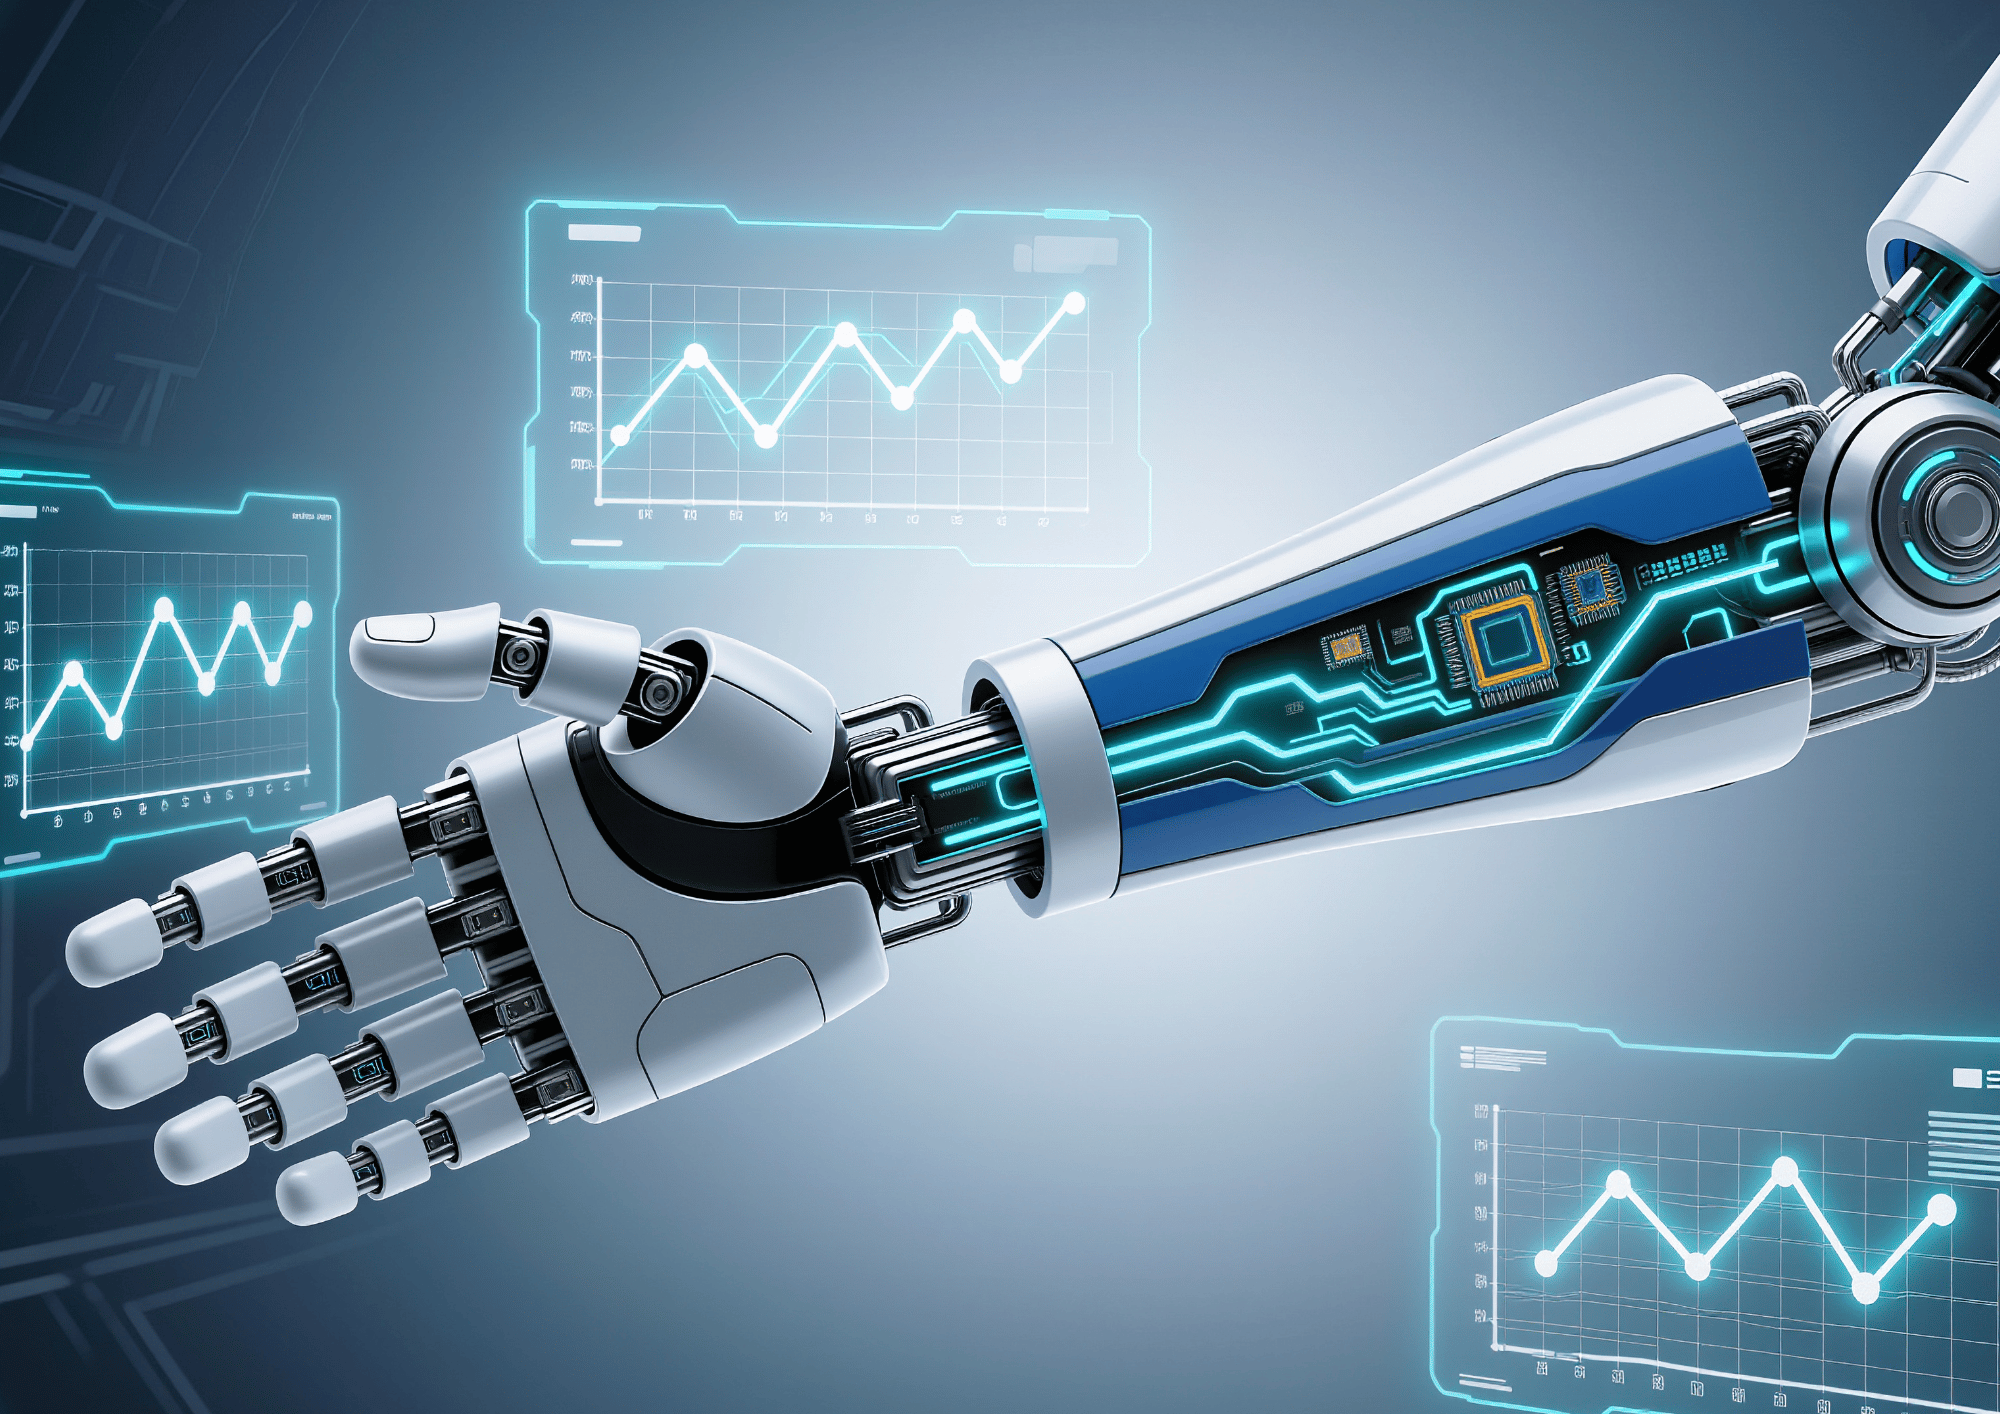
Innovation Footprints in Tech Stock Markets
Can Wall Street smell the future, or only read the headlines afterwards?
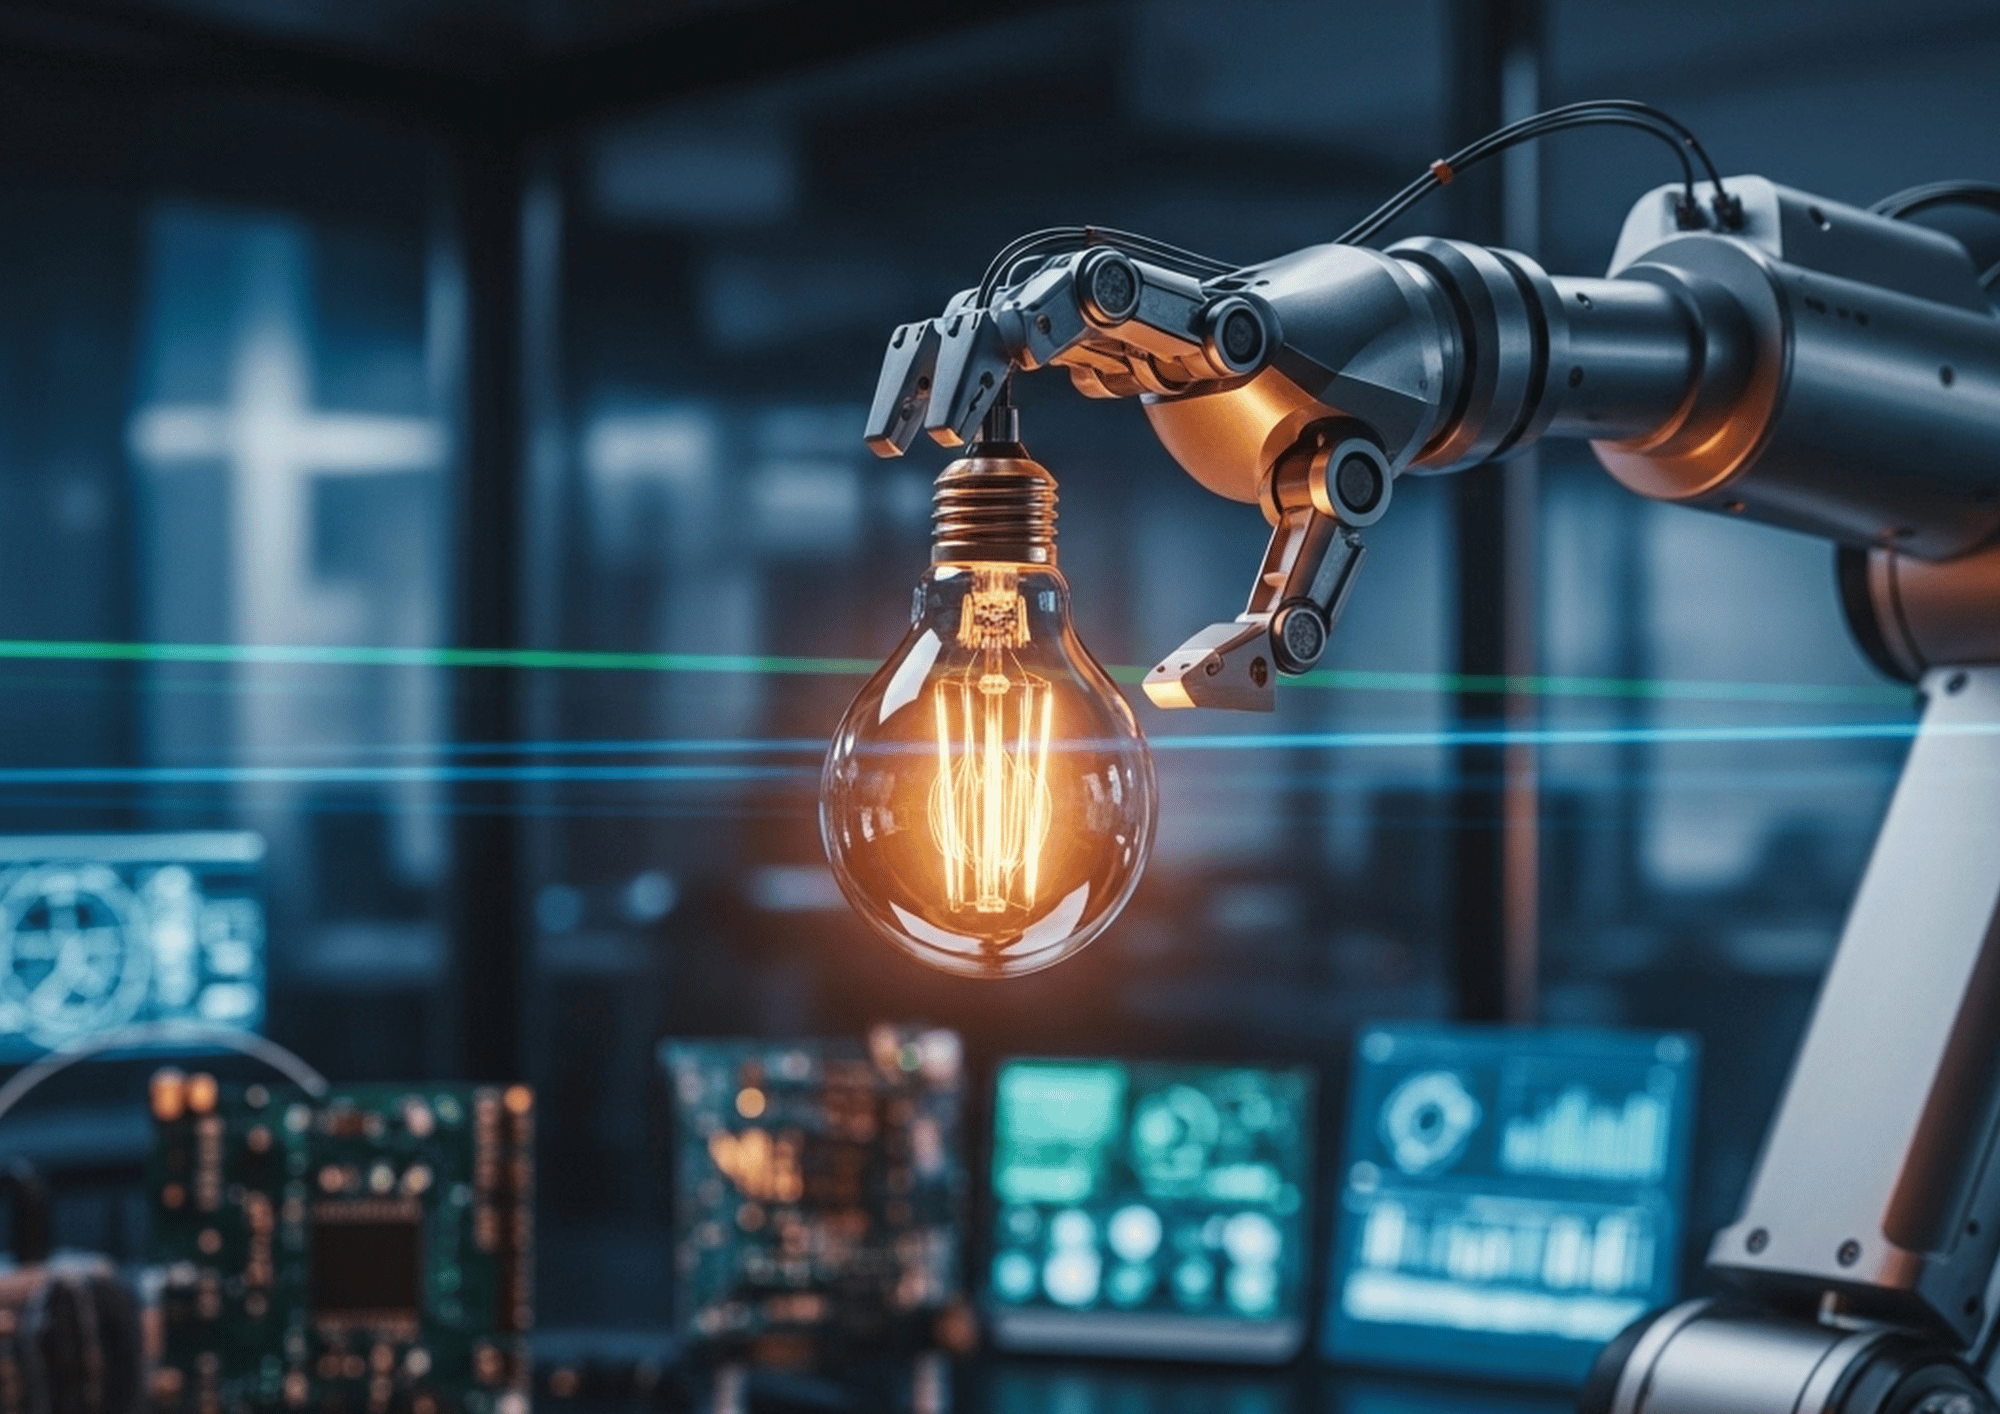
Prologue, The Problem with "Obvious" Innovation
There's a peculiar comfort in hindsight. Standing in 2025, we can look back at the last two decades and confidently point to the moments that changed everything: the iPhone launch in 2007, the emergence of CUDA that made GPU computing possible, the mRNA vaccines that ended a pandemic, and ChatGPT's explosion onto the scene.
These innovations feel almost predestined now, obvious turning points in the long arc of technological progress. But here's the uncomfortable truth that every investor, analyst, and curious observer must confront: on the day these innovations were announced, they didn't feel obvious at all.
When Steve Jobs unveiled the iPhone, critics complained about the price tag and the lack of a physical keyboard. When NVIDIA released CUDA in 2007, it was a technical curiosity that most investors ignored entirely. When Tesla revealed the Cybertruck, the "unbreakable" windows shattered on live television and Twitter exploded with mockery. History's turning points, it seems, rarely announce themselves with fanfare.
This creates a fascinating puzzle: if the stock market is supposed to be a forward-looking machine, pricing in future expectations, aggregating the wisdom of millions of investors, why does it so often miss the importance of transformative innovations?
Or does it?
Perhaps the market does recognize breakthrough innovations, just not in the way we expect. Perhaps the signal is there, hidden in the noise of daily price movements, waiting to be decoded by those patient enough to look.
That's what this investigation is about.
The Footprint Metaphor
Imagine innovation as an animal walking through fresh snow. If the animal is real, if it truly passed through, it should leave footprints. Traces. Evidence of its passage that a careful tracker can detect and follow.
In financial markets, these footprints take specific forms:
- Sharp event-day reactions, pronounced price moves when headlines hit, the market's first verdict on the news.
- Unusual trading volume, evidence that investors are paying attention and repositioning around the news.
- Anticipation before the event, gradual drift in prices in the weeks before the announcement.
- Long, slow-burning revaluation, weak day 0 reaction, followed by rising conviction over weeks.
Our mission is to search for these footprints across two decades of innovation history.
When history happens, does the market react right away, or only once everyone knows it was history?
A Timeline of Turning Points
Before we dive into the data, let’s set the stage with the full scope of our investigation. We analyzed 45 innovation events spanning two decades and five domains of human progress. These aren’t just any product launches or press releases, they’re moments that, in retrospect, fundamentally changed their industries.
The breadth of our investigation is intentional. Innovation takes many forms, and we wanted to understand whether the market recognizes different types of breakthroughs in different ways. A consumer gadget like the iPod is visible to everyone, millions saw the keynote, tried the product, formed opinions. But a computing platform like CUDA is invisible to most people, even as it quietly enables everything from video games to self-driving cars to ChatGPT.
| Domain | Companies/Events | Time Period | Examples |
|---|---|---|---|
| Consumer Tech | Apple (8 events) | 2001-2023 | iPod, iPhone, iPad, AirPods, M1 Chip, Vision Pro |
| Compute Platforms | NVIDIA (8 events) | 2007-2024 | CUDA, DGX-1, V100, Blackwell B200 |
| Electric Vehicles | Tesla (8 events) | 2014-2024 | Autopilot, Model 3, Cybertruck, FSD v12 |
| Innovation Stack | Top 25 market-cap leaders across the innovation stack (12 events) | 2006-2023 | S3, EUV, iPhone, Chrome, Azure, TensorFlow, LLaMA, Vision Pro |
| Healthcare | Top 25 Healthcare Companies (10 events) | 2020-2024 | mRNA vaccines, GLP-1 drugs, CRISPR therapy |
Each event in this table represents a moment when someone believed they were witnessing history. Our job is to determine whether Wall Street agreed, and when.
Act I - Meet the Cast
Innovation doesn't wear a single costume. It arrives in many forms, each with its own personality, its own audience, and its own relationship with the stock market. Before we can understand how markets recognize innovation, we need to understand the different types of innovation we're studying.
Think of this chapter as meeting the characters in our story. Each company and sector brings something unique to our investigation. They come with different patterns of market recognition, different investor expectations, and different relationships between hype and substance.
1. Consumer Tech (e.g., Apple)
The spotlight category. Highly visible launches where everyone has an opinion within hours.
Question: does visibility help the market understand, or just amplify noise?
2. Compute Platforms (e.g., NVIDIA)
Invisible infrastructure. Platforms most people never see, yet they power everything from AI to medicine.
Question: can markets price value that the public can't experience directly?
3. EVs & Robotics (e.g., Tesla)
Innovation performed live. A mix of engineering, hype cycles, and very public execution risk.
Question: are investors pricing engineering, or belief?
4. Innovation Stack Shockwaves (e.g., Amazon, Google, Meta)
A platform shift rarely moves one ticker, it replaces the whole stack: chips, cloud, platforms, and software. We track a basket of 25 leaders to see whether the market moves together or splits into winners and losers.
Question: is it a rising tide or a reshuffling?
5. Biotech & Health (e.g., mRNA, GLP-1, CRISPR)
Innovation behind a regulatory gate. Uncertainty collapses when approval arrives.
Question: do binary "yes/no" moments create the cleanest footprints?
1. Consumer Tech, Apple: When Innovation Is Visible to Everyone
There’s something almost theatrical about Apple product launches. The hushed anticipation as Tim Cook, or before him, Steve Jobs, walks onto a stage. The carefully choreographed “one more thing” moments. The live blogs updating second by second as journalists race to describe what they are seeing. Within hours, millions of people have formed opinions. Some are enthusiastic, some are skeptical, and many land somewhere in between.
Apple events are perhaps the most public innovations on Earth. They happen in broad daylight, under the glare of media attention. Financial analysts publish instant takes. Twitter erupts with hot takes and memes. The stock moves in real time as traders try to price in what they are seeing.
And yet, this visibility creates a paradox: does being able to see an innovation clearly help the market understand it?
Consider the skepticism that greeted some of Apple’s most successful products. When the iPod launched in October 2001, Apple was struggling. The dot com bust had devastated tech stocks. The company was known for expensive computers that few people bought. And now they wanted $399 for an MP3 player, during a recession. The market’s initial verdict was a yawn, or worse.
The iPhone faced similar skepticism. “No physical keyboard,” critics complained. “$600 is too expensive for a phone.” “It only works on AT&T.” These were not fringe opinions. They were mainstream analyst takes.
We analyzed eight landmark Apple events spanning 22 years to understand how markets process highly visible consumer innovation:
| Event | Date | What It Was | The Skeptic’s Take |
|---|---|---|---|
| iPod Launch | Oct 23, 2001 | “1,000 songs in your pocket” | An overpriced MP3 player in a recession |
| iPhone Launch | Jun 29, 2007 | Phone + iPod + Internet device | Too expensive, no keyboard, carrier locked |
| iPad Launch | Apr 3, 2010 | A tablet computer | Just a bigger iPod Touch, no laptop replacement |
| iPhone 5S Touch ID | Sep 20, 2013 | Fingerprint authentication | Nice feature, but not a selling point |
| Apple Pay Launch | Oct 20, 2014 | Tap to pay with your iPhone | Too early, nobody will change how they pay |
| AirPods Launch | Dec 13, 2016 | Truly wireless earbuds | They look ridiculous, easy to lose |
| M1 Chip Announcement | Nov 10, 2020 | Apple’s own silicon | Can they really beat Intel? Risky bet |
| Vision Pro Announcement | Jun 5, 2023 | Spatial computing headset | $3,500, no killer app, VR has failed before |
Notice the pattern? The market, the media, and often the public were skeptical on day one. The iPhone was “overpriced.” The AirPods looked “weird.” The M1 seemed like a dangerous bet against decades of Intel partnership.
What makes Apple’s story particularly instructive is that we know how it ends. These doubts turned into successes. The “overpriced” iPhone generated more revenue than any product in human history. The “weird” AirPods created an entirely new product category. Apple Silicon delivered exactly what Apple promised.
So the question for our investigation becomes: did the stock market share the skeptic’s doubts, or did it see through the noise to recognize value?
2. Compute Platforms, NVIDIA: Innovation Beneath the Surface
If Apple innovations happen in the spotlight, NVIDIA innovations happen in the shadows, invisible to most people, yet profoundly shaping the technology they use every day.
Consider this: when you ask ChatGPT a question, you are using NVIDIA hardware. When a Tesla navigates traffic using Autopilot, NVIDIA chips process the camera feeds. When a hospital uses AI to detect tumors in medical images, NVIDIA GPUs do the heavy lifting. The company’s technology is everywhere, and yet most people have never thought about it.
This creates a fascinating market puzzle. How do investors price innovations that most people can’t see, touch, or directly experience?
NVIDIA’s story spans three distinct eras. In the early 2000s, it was a gaming company, a maker of graphics cards that rendered video game worlds in ever more realistic detail. In the 2010s, it became a deep learning company, its GPUs turned out to be unexpectedly perfect for training neural networks. In the 2020s, it became the AI company, the essential infrastructure provider for the entire artificial intelligence revolution.
Each transition was driven by specific product launches and platform innovations. We analyzed eight NVIDIA milestones that marked these pivotal moments:
| Event | Date | The Innovation | Why It Mattered (In Hindsight) |
|---|---|---|---|
| CUDA Launch | Jun 23, 2007 | GPU computing becomes programmable | Enabled the deep learning revolution a decade later |
| DGX-1 Launch | Apr 5, 2016 | Deep learning system in a box | Turned NVIDIA GPUs into an AI platform |
| Tesla V100 Launch | May 10, 2017 | First Tensor Cores for AI | Purpose built AI hardware changes the game |
| RTX 2080 Ti Launch | Aug 20, 2018 | Real time ray tracing | New visual computing paradigm for games and beyond |
| A100 Ampere Launch | May 14, 2020 | 20x AI performance leap | The engine that would power ChatGPT training |
| Arm Acquisition Attempt | Sep 13, 2020 | $40B semiconductor empire bid | Audacious reach for chip industry dominance |
| H100 Hopper Launch | Mar 22, 2022 | The AI training workhorse | Every AI lab in the world would want these |
| Blackwell B200 | Mar 18, 2024 | 208 billion transistor monster | Next generation of AI infrastructure |
The CUDA story is particularly instructive. In June 2007, NVIDIA announced that programmers could now write general purpose code that would run on graphics cards. At the time, this seemed like a niche feature, interesting to researchers, perhaps, but hardly earth shattering for the gaming focused company.
Nobody imagined that this technical capability would become the foundation of modern artificial intelligence. Nobody foresaw that CUDA would power the training of AlexNet in 2012, igniting the deep learning revolution. Nobody predicted that a decade later, the entire AI industry would depend on NVIDIA hardware.
Did the market see it coming? Did anyone? That’s what we set out to discover.
3. Electric Vehicles and Robotics, Tesla: Innovation Performed Live
Tesla exists in a category entirely its own. It’s not just a car company. It’s a narrative, a movement, a perpetual drama that plays out on social media, in stock trading apps, and on stages designed for maximum impact.
When Elon Musk walks onto a Tesla stage, he’s not just announcing a product. He’s putting on a show. And sometimes the show goes spectacularly wrong, like when the “unbreakable” Cybertruck windows shattered on live television, sending social media into a frenzy and creating one of the most memorable product demonstration failures in corporate history.
But here’s the thing: the Cybertruck reveal, despite the broken windows, generated over 200,000 reservations in less than 48 hours. The spectacle worked, even when it failed.
This creates unique challenges for understanding market recognition. With Apple or NVIDIA, we’re analyzing how markets respond to technology. With Tesla, we’re analyzing how markets respond to theater, and trying to separate genuine innovation recognition from hype cycles, cult of personality effects, and meme stock dynamics.
We analyzed eight Tesla moments that capture this unique dynamic:
| Event | Date | The Story | The Drama |
|---|---|---|---|
| Autopilot Announcement | Oct 10, 2014 | Autopilot hardware announced | Suddenly competing with Google |
| Model 3 First Deliveries | Jul 28, 2017 | First Model 3 deliveries begin | “Production hell” nightmares start |
| Cybertruck Reveal | Nov 21, 2019 | Electric truck unveiled | Broken windows, polarized reactions |
| Tesla Bot Announcement | Aug 19, 2021 | Optimus revealed at AI Day | Dancing human in robot costume |
| Dojo Supercomputer | Aug 19, 2021 | Dojo unveiled at AI Day | Tesla wants its own AI factory |
| Cybertruck Deliveries Begin | Nov 30, 2023 | First Cybertruck deliveries | Four years of waiting ends |
| Optimus Gen 2 Reveal | Dec 13, 2023 | Second gen Optimus update | Better demo, timeline still unclear |
| FSD v12 Wide Rollout | Mar 16, 2024 | End to end neural FSD rollout | Autonomy meets reality |
Tesla’s relationship with expectations is complicated. The Model 3 deliveries proved the product was real, but they also triggered the harder question, can Tesla scale without breaking? The Cybertruck reveal went viral for the wrong reasons and still created demand. At AI Day, Tesla unveiled both Optimus and Dojo, two bets that pushed the story beyond cars and into robots and compute.
The Tesla Bot announcement perfectly encapsulates the company’s unique position. Elon Musk announced that Tesla would build humanoid robots to perform dangerous or boring tasks. The company’s credentials, experience with AI, sensors, motors, manufacturing, made the idea at least plausible. But the presentation featured a human dancer in a robot costume, inviting mockery. Was this visionary innovation or tech hype theater?
The later updates, Optimus Gen 2 and the FSD v12 rollout, show the same pattern at a different intensity. Each step forward is real, but the market keeps asking whether the timeline is finally catching up to the story.
When spectacle and substance blur together, how does the market respond? Tesla gives us the perfect laboratory to find out.
4. Innovation Stack Shockwaves, When One Innovation Moves Everything
Some innovation footprints do not belong to one company. They belong to a stack.
When a platform shift happens, the market does not move one ticker. It reprices a web of suppliers, customers, competitors, and complements.
That is why this project includes a different kind of case file, a basket view of the innovation stack. Instead of tracking one stock, we track a basket of the 25 largest, most liquid market-cap leaders across semiconductors, cloud, platforms, and enterprise software, and we ask a wider question.
When the stack is hit by a turning point, do stocks move together, or does the market split into winners and losers?
We anchored this lens around twelve turning point innovations that moved multiple companies at once:
| Event | Date | What Happened | Expected Beneficiaries |
|---|---|---|---|
| Amazon S3 Launch | Mar 14, 2006 | Cloud storage becomes a utility | AMZN, MSFT, GOOGL, ORCL |
| ASML First EUV Tools | Aug 29, 2006 | EUV lithography enables leading edge chips | ASML, TSM, INTC, NVDA |
| iPhone Launch | Jun 29, 2007 | Mobile computing goes mainstream | AAPL, QCOM, TSM, AVGO |
| Google Chrome Beta Launch | Sep 2, 2008 | The modern web runtime arrives | GOOGL, MSFT, AAPL, META |
| Microsoft Azure Launch | Feb 1, 2010 | Cloud becomes enterprise default | MSFT, AMZN, GOOGL, ORCL |
| iPhone 5S Touch ID | Sep 20, 2013 | Biometrics becomes default UX | AAPL, QCOM, TSM, AVGO |
| TensorFlow Open-Sourced | Nov 9, 2015 | AI tooling becomes a platform | GOOGL, NVDA, AMD, MSFT |
| Armv9 Architecture Introduced | Mar 30, 2021 | Next gen CPU era, security plus efficiency | ARM, AAPL, QCOM, TSM |
| Meta LLaMA Release | Feb 24, 2023 | Open source LLM shockwave | META, NVDA, AMD, GOOGL |
| GPT-4 Release | Mar 14, 2023 | Capability leap accelerates AI adoption | MSFT, NVDA, GOOGL, META |
| Microsoft Copilot Announcement | Mar 16, 2023 | Enterprise AI goes mainstream | MSFT, NVDA, CRM, ORCL |
| Vision Pro Announcement | Jun 5, 2023 | Spatial computing arrives | AAPL, TSM, QCOM, AVGO |
The choice to analyze 25 market-cap leaders, rather than focusing on obvious winners like NVIDIA or Apple, was deliberate. We wanted to answer a more nuanced question: when a turning point hits the stack, does value concentrate in a few winners, or spread broadly across the ecosystem?
The “winner ratio”, the percentage of companies that end up with positive returns 30 days after an event, became our key metric. A high winner ratio suggests a broad repricing across the stack. A low winner ratio suggests a selective move, a few winners and many laggards.
5. Biotech and Healthcare, Innovation With a Regulatory Gate
Healthcare innovations operate under rules fundamentally different from anything in technology. When Apple announces an iPhone, customers can buy it within weeks. When NVIDIA launches a GPU, data centers can order them immediately. The path from announcement to adoption is relatively smooth.
In healthcare, a massive gate stands between announcement and reality: regulatory approval.
Consider the journey of a new drug. A pharmaceutical company might announce promising trial results, but that drug won’t help any patients until the FDA, or equivalent regulators elsewhere, grants approval. That approval might come quickly, or it might take years. It might come with conditions, or it might not come at all. The uncertainty is enormous.
This creates something unique in markets: binary events with massive stakes. The day an FDA approval is announced, a treatment goes from “might work” to “will work” in a single moment. Uncertainty collapses. Billions of dollars in value can be created or destroyed overnight.
The COVID 19 pandemic brought this dynamic into sharp focus. On December 11, 2020, the FDA granted emergency use authorization to Pfizer BioNTech’s Comirnaty vaccine, the first mRNA vaccine ever approved for human use. It wasn’t just a drug approval. It was validation of an entirely new platform technology that had been in development for decades.
We analyzed ten healthcare breakthroughs that represent different types of medical innovation:
Drug and Treatment Innovations:
| Event | Date | The Stakes | The Promise |
|---|---|---|---|
| First mRNA Vaccine (Comirnaty) | Dec 11, 2020 | Revolutionary platform | New way to build vaccines forever |
| Wegovy GLP 1 Weight Loss | Jun 4, 2021 | Obesity treatment | First true weight loss drug |
| Paxlovid Oral Antiviral | Dec 22, 2021 | At home treatment | Turn COVID into a manageable disease |
| Mounjaro (Tirzepatide) | May 13, 2022 | Diabetes breakthrough | Dual hormone approach changes outcomes |
| Leqembi Alzheimer’s Approval | Jan 6, 2023 | First disease slowing drug | Proof Alzheimer’s can be treated |
| Zepbound Obesity Launch | Nov 8, 2023 | Massive blockbuster potential | GLP 1 competition accelerates |
| Casgevy CRISPR Therapy | Dec 8, 2023 | Gene editing becomes real | Cure genetic diseases at the source |
Technology and AI Innovations:
| Event | Date | The Stakes | The Promise |
|---|---|---|---|
| AlphaFold 2 Breakthrough | Nov 30, 2020 | Protein folding solved | Accelerate drug discovery dramatically |
| GPT 4 Medical AI Release | Mar 14, 2023 | Medical AI advances | Better diagnosis and imaging analysis |
| Da Vinci 5 Surgical Robot | Mar 14, 2024 | Next gen robotic surgery | Precision surgery advances |
The GLP 1 story is particularly remarkable. Drugs like Wegovy and Mounjaro haven’t just helped diabetics control their blood sugar. They’ve produced unprecedented weight loss in clinical trials. This has created ripple effects far beyond the pharmaceutical companies making them. Food companies have seen their stocks affected. Weight Watchers restructured its business. Fitness chains adjusted their projections. Medical device companies serving obese patients reconsidered their futures.
Healthcare gives us something tech rarely provides: clean, binary moments where we can measure market recognition with precision. When the FDA says yes, there’s no ambiguity. The footprint should be unmistakable.
Act II - The Detective Method
The Event Study Method
We've met our cast of innovations. Now we need a way to detect, and measure, their footprints in market data. In finance, the standard tool for this is an event study.
Looking at the event day alone is not enough. Stocks move for countless reasons, market drift, macro surprises, competitor news. An event study focuses on the window around an announcement to separate signal from noise.
We run the same three-step workflow for every domain:
Pin the event day
Define the innovation date. If it lands on a weekend or holiday, shift to the next trading day.
Extract a window
Pull price and volume for 30 trading days before and after, so we can see anticipation, reaction, and digestion.
Measure the footprint
Compute returns, cumulative returns, volatility, and volume changes, then compare pre vs post behavior.
We reuse the same pipeline across domains. Only the ticker list and event calendar change.
Event window, 61 trading days
We center each event at t = 0, then watch 30 trading days before and after to separate anticipation, reaction, and digestion.
Pre-event
Positioning, leaks, and anticipation drift if investors expected the news.
Event day
Headlines hit, the first repricing shows up in returns, volume, and volatility.
Post-event
Digestion phase, does the move stick, reverse, or slowly build after the story spreads.
Key formulas, the footprint checklist
These are the metrics we compute for every event window today. The panel below expands the same ideas with examples.
Core metrics
Return
The daily percentage move, the basic unit behind every footprint.
Log return
A return measure that stacks cleanly across days, useful for long windows.
Cumulative return
The buy-and-hold story inside the window: buy on event day and hold for t days.
Volatility
Uncertainty proxy. Breakthroughs can increase volatility, or reduce it once uncertainty collapses.
Volume change
Attention proxy, average volume after vs before, expressed as a percentage.
The Mathematics of Market Footprints
The checklist above is the compact version. This panel shows the exact math we compute in code, with plain-language interpretation.
1) Return and log return
\[R_t = \left(\frac{P_t - P_{t-1}}{P_{t-1}}\right) \times 100\]Daily return is the percentage move from yesterday’s close \(P_{t-1}\) to today’s close \(P_t\).
Log return is a closely related measure that adds cleanly across time:
\[r_t = \ln\!\left(\frac{P_t}{P_{t-1}}\right) \times 100\]Example: if a stock closed at $150 yesterday and closes at $153 today, the daily return is:
\[\frac{153 - 150}{150} \times 100 = 2\%\]2) Planned extension, abnormal return and CAR
To isolate the event from the market’s noise, we can add a market-adjusted baseline (next upgrade on our roadmap):
\[AR_t = R_t - R_{m,t}\]Here \(R_{m,t}\) is the benchmark return (a broad market index) on the same day. We then sum abnormal returns across a window to get cumulative abnormal return:
\[CAR_{[a,b]} = \sum_{t=a}^{b} AR_t\]Interpretation: positive CAR means the stock outperformed the market across the window, negative CAR means it underperformed.
3) Cumulative return (simple buy-and-hold)
Sometimes the cleanest story is also the simplest: buy on event day and hold.
\[CR_t = \left(\frac{P_t}{P_0} - 1\right) \times 100\]4) Volatility, how uncertain was the market?
Volatility measures how wildly returns jump around. High volatility means investors disagree, so prices swing dramatically from day to day.
\[\sigma = \sqrt{\frac{1}{n-1}\sum_{i=1}^{n}(R_i - \bar{R})^2}\]For innovation, volatility can spike on surprise, then fall once uncertainty resolves through price discovery.
5) Volume change, how much attention did it get?
Trading volume measures attention. When something important happens, more investors trade. They buy if they are excited, sell if they are skeptical, and reposition either way.
\[VC = \left(\frac{\bar{V}_{post}}{\bar{V}_{pre}} - 1\right) \times 100\]In plain English: compare average volume after the event \(\bar{V}_{post}\) to average volume before \(\bar{V}_{pre}\), expressed as a percentage.
Interpretation: high volume plus positive returns suggests informed enthusiasm. High volume plus negative returns can indicate informed concern, or messy disagreement.
From One Company to Many
Single-stock event studies make sense for Apple, NVIDIA, and Tesla. For ecosystem shocks like ChatGPT, the point is not one ticker. It is the breadth of the reaction.
For AI and healthcare events, we track multiple companies simultaneously and measure how many finish the window positive, the Winner Ratio:
\( \text{Winner Ratio} = \frac{\text{Number of companies with positive 30-day return}}{\text{Total companies}} \times 100 \)
High winner ratio = broad transformation; low winner ratio = selective winners and losers.
Act III - Case Files Across the Innovation Landscape
The stage is set. You understand our method. Now comes the exciting part: what did we actually find?
Rather than marching through companies one by one, we’ve organized our findings by what they teach us about market recognition. Each chapter that follows reveals a different facet of how markets process innovation, and each tells a story that challenges conventional wisdom about the efficiency of financial markets.
Chapter 1 - Apple: The Slow Recognition of Visible Innovation

Apple’s innovations are the most watched, most analyzed, most debated product launches on Earth. Millions tune in to keynotes. Thousands of articles appear within hours. Every financial analyst in tech has an opinion.
And yet, perhaps because of all this attention, Apple innovations reveal something profound about how markets process information: visibility doesn’t guarantee understanding.
The iPod Paradox (October 23, 2001)
Picture the scene: October 2001. The dot-com bubble has burst. The tech industry is in shambles. Apple is a struggling computer company with a cult following but shrinking market share. Into this gloom, Steve Jobs walks onto a stage and announces… an MP3 player.
“1,000 songs in your pocket,” he proclaimed, unveiling the iPod. Price tag: $399. In a recession. For a music player, when you could buy a Sony Walkman for $50.
The market’s verdict on announcement day was clear: Apple stock fell 4.63%.
Wall Street saw an overpriced gadget. Analysts questioned whether anyone would pay $399 for a device that played music. The skeptics made compelling arguments: MP3 players already existed, Apple had no experience in consumer electronics beyond computers, and the economy was terrible.
But then something remarkable happened. Over the next 30 days, as people actually saw the iPod, as the elegance of the click wheel and the iTunes integration became clear, the market quietly changed its mind.
30-day cumulative return: +30.98%
The iPod story is the perfect example of what we call the “Slow Burn” pattern, an innovation that looks unremarkable on day one but proves transformative over time. The market’s initial skepticism wasn’t irrational; it was based on reasonable concerns about price and competition. But as more information emerged, early reviews, initial sales figures, the experience of actually using the device, the market gradually recognized what it had missed.
The iPod wasn’t just a music player. It was Apple’s entry into consumer electronics, the first step in a journey that would lead to the iPhone, the iPad, and Apple’s transformation into the most valuable company on Earth. But on October 23, 2001, that future was invisible to almost everyone, including, seemingly, Wall Street.
The M1 Chip: When Platform Shifts Get Noticed
Not all Apple innovations follow the slow-burn pattern. The M1 chip announcement in November 2020 tells a different story, one of almost immediate recognition.
For 15 years, Apple had built its Mac computers around Intel processors. The switch to Intel in 2006 had been a major strategic decision, and the partnership seemed stable. Then, at WWDC 2020, Apple announced it was leaving Intel behind entirely, building its own processors for Mac, the same approach it had pioneered with the iPhone and iPad.
This was risky. Intel chips were the industry standard. Countless software applications were optimized for Intel architecture. Developers would need to rewrite their code. The transition could have been a disaster.
On announcement day (November 10, 2020), Apple’s stock barely moved: -0.30%. The market wasn’t sure what to make of the news.
But as the M1’s performance benchmarks leaked out, dramatically outperforming Intel while using a fraction of the power, the market started to pay attention. And as reviewers got their hands on M1 Macs and confirmed the remarkable performance, conviction grew.
30-day cumulative return: +12.93%
The M1 story shows that markets can recognize platform shifts, it just takes time for the implications to sink in. The event-day return was essentially zero. But over the following month, as investors digested what Apple Silicon meant for margins, performance, and competitive positioning, a substantial revaluation occurred.
Apple Event Summary: All 8 Events Compared
When we step back and look at all eight Apple events together, a striking pattern emerges:
| Event | Day-0 Return | 30-Day Return | The Pattern |
|---|---|---|---|
| iPod Launch | -4.63% | +30.98% | Classic slow burn |
| iPhone Launch | +1.23% | +4.71% | Muted, waiting for App Store |
| iPad Launch | +1.07% | +6.60% | Quiet, steady adoption |
| iPhone 5S Touch ID | -1.04% | +11.26% | Security innovation rewarded |
| Apple Pay Launch | +2.14% | +15.40% | Services flywheel gets priced in |
| AirPods Launch | +1.67% | +5.87% | Surprise hit |
| M1 Chip | -0.30% | +12.93% | Platform shift recognized |
| Vision Pro | -0.76% | +8.64% | Spatial computing bet |
💡 Key insight: For Apple, event-day returns are nearly useless for predicting 30-day outcomes. The iPod dropped 4.6% on announcement day but became Apple’s turnaround story. The correlation between day-0 and 30-day returns is essentially zero.
This tells us something profound about consumer innovation: the market’s first reaction is often noise. The signal emerges over weeks, not hours.
Chapter 2 - NVIDIA: The Infrastructure Play
If Apple represents visible consumer innovation, products you can hold, use, show your friends, NVIDIA represents something entirely different: invisible infrastructure that powers the digital world.
You’ve probably never thought about NVIDIA while using ChatGPT. But tens of thousands of NVIDIA GPUs trained the model you’re talking to. When a Tesla navigates traffic, NVIDIA chips process the camera feeds. When a pharmaceutical company uses AI to discover new drugs, NVIDIA hardware runs the calculations.
This invisibility creates a fascinating market dynamic. How do investors price innovations that most people can’t see, touch, or directly experience? The answer, it turns out, depends enormously on timing.
Tesla V100 Launch (May 10, 2017): The Market Gets It
Fast forward ten years. By 2017, deep learning had exploded. Every tech giant was racing to build AI capabilities. The demand for GPU computing had gone from academic curiosity to industrial necessity.
Into this environment, NVIDIA launched the Tesla V100, the first GPU with “Tensor Cores,” specialized circuits designed specifically for the matrix math at the heart of neural networks. This wasn’t a gaming card that happened to be good at AI; it was a purpose-built AI accelerator.
The market’s response was immediate and unmistakable:
Event day return: +17.83%
30-day return: +30.71%
This is what we call an “Instant Footprint”, immediate, sustained, unmistakable recognition. The market understood that NVIDIA had created the essential hardware for the AI revolution. No slow burn, no gradual awakening. The footprint was there on day one.
Why the difference between NVIDIA’s earlier platform bets and the V100’s instant recognition? Context. In 2017, deep learning was the hottest technology in the world, and demand for AI computing was exploding. The market could see the V100’s value because it could see the demand.
H100 Hopper Launch (March 22, 2022): Right Chip, Wrong Tape
In March 2022, NVIDIA introduced Hopper, the H100, a GPU designed to be the workhorse of modern AI training. On paper, this should have been another clean, instant footprint.
Instead, the market did the opposite:
Event day return: -0.79%
30-day return: -23.34%
The explanation is not that the innovation was weak. It is timing. 2022 was a brutal tech drawdown. Rates were rising, growth multiples were compressing, and investors were de-risking. Even a real breakthrough had to fight for oxygen.
Hopper matters in hindsight because it shows a hard truth about market recognition. Sometimes the market sees the future, and still refuses to pay for it, because the present is on fire.
NVIDIA Event Summary: All 8 Events Compared
| Event | Day-0 Return | 30-Day Return | Pattern Type |
|---|---|---|---|
| CUDA Launch | -2.64% | +2.61% | Decade-long slow burn |
| DGX-1 Launch | -0.14% | +18.27% | Quiet platform shift |
| Tesla V100 | +17.83% | +30.71% | Instant recognition |
| RTX 2080 Ti | +1.23% | +15.65% | Strong innovation |
| A100 Ampere | +3.22% | +14.05% | Datacenter bet pays |
| Arm Acquisition | +5.82% | +2.09% | Deal skepticism |
| H100 Hopper | -0.79% | -23.34% | Bear market overwhelms |
| Blackwell B200 | +0.70% | -2.32% | High expectations |
The key insight: NVIDIA’s story reveals that timing is everything for infrastructure innovation. The same company can release equally important innovations and see completely different market responses, depending on whether the demand for that innovation is already visible.
CUDA in 2007 was a solution looking for a problem. DGX-1 in 2016 was NVIDIA packaging the solution before the world fully understood the scale of the problem. The V100 in 2017 was a solution to a problem everyone was desperately trying to solve. Same company, same engineering excellence, vastly different market recognition.
Chapter 3 - Tesla: Hype, Skepticism, and Spectacle
Tesla defies easy categorization. It’s not just a car company, it’s a phenomenon, a cultural touchstone, a perpetual drama playing out in real-time across social media, financial news, and Elon Musk’s Twitter feed.
This creates unique challenges for understanding market recognition. With Apple, we’re analyzing how markets respond to technology. With NVIDIA, we’re analyzing how markets respond to infrastructure demand. With Tesla, we’re analyzing how markets respond to narrative, spectacle, and the complex psychology of believing in the future.
Cybertruck Reveal (November 21, 2019): When Spectacle Wins
The Cybertruck reveal was the most viral product unveiling in automotive history, and not entirely for the reasons Tesla intended.
When Elon Musk invited his lead designer to throw a metal ball at the truck’s “unbreakable” windows, the window shattered. On live television. In front of a cheering crowd. The designer threw a second ball at the rear window. It shattered too.
Twitter exploded. Memes proliferated. “Cybertruck fail” trended worldwide.
And then something remarkable happened: 200,000+ reservations in the first 48 hours.
The spectacle worked, not despite the failure, but perhaps because of it. The broken windows made the event unforgettable. The polarizing design sparked endless debate. Everyone was talking about Tesla.
Event day return: +0.74%. Surprisingly muted given the viral explosion.
30-day return: +32.19%
The Cybertruck reveal shows something important about Tesla’s relationship with markets: spectacle can create sustained momentum, even when the spectacle includes embarrassing failures. The event generated attention, attention generated interest, interest generated reservations, reservations suggested demand, and demand supported stock price.
Whether this represents “real” innovation recognition or hype-driven speculation is still debated. But the footprint is undeniable.
AI Day (August 19, 2021): Optimus and Dojo, Vision Meets Skepticism
Tesla AI Day was a perfect example of why Tesla is hard to analyze. On one stage, Tesla revealed two ambitious bets:
- Optimus (Tesla Bot), a humanoid robot vision that pushed the story beyond cars
- Dojo, a custom supercomputer designed to train autonomy models at scale
Both announcements landed on the same trading day, so they share the same footprint:
Event day return: -2.25%
30-day return: +15.11%
Day one looked like doubt. The robot reveal included a human dancer in a costume. The Dojo story was technical and easy to dismiss as a slide deck promise. But over the next month, the stock rallied anyway. Tesla was still being priced as a company that might become more than a car company.
Shipping the Future (Late 2023 to 2024): Reality Checks, and One Big Jump
By late 2023, Tesla was under pressure, margins were tightening, and the market wanted evidence, not just narratives. The next three events are the same story in three different moods:
- Cybertruck Deliveries Begin (Nov 30, 2023): -1.66% day-0, -8.40% over 30 days (reality arrives, the stock sells the news)
- Optimus Gen 2 Reveal (Dec 13, 2023): +0.96% day-0, -20.21% over 30 days (a better demo, but the market keeps de-risking)
- FSD v12 Wide Rollout (Mar 16, 2024): +6.25% day-0, +5.45% over 30 days (a rare clean headline pop, modest follow-through)
Tesla is not one company in markets. It is three, and the stock swings between them: automaker, software bet, and moonshot lab.
Tesla Event Summary: All 8 Events Compared
| Event | Day-0 Return | 30-Day Return | What Happened |
|---|---|---|---|
| Autopilot Announcement | -7.82% | +2.48% | Skepticism to acceptance |
| Model 3 First Deliveries | +0.18% | +8.54% | Execution beats fears |
| Cybertruck Reveal | +0.74% | +32.19% | Viral over rational |
| Tesla Bot Announcement | -2.25% | +15.11% | Skepticism to curiosity |
| Dojo Supercomputer Announcement | -2.25% | +15.11% | Big ambition, same day |
| Cybertruck Deliveries Begin | -1.66% | -8.40% | Reality arrives late |
| Optimus Gen 2 Reveal | +0.96% | -20.21% | Demo improves, stock slides |
| FSD v12 Wide Rollout | +6.25% | +5.45% | Big jump, modest drift |
The key insight: Tesla events are highly unpredictable. The correlation between day-0 reactions and 30-day outcomes is essentially random, weaker than for Apple, weaker than for NVIDIA, close to zero.
This reflects Tesla’s unique position in markets: it’s priced on belief in the future, not analysis of the present. And belief is volatile. It can surge on spectacle and crash on disappointment. The footprints exist, but they’re chaotic, reflecting the chaotic nature of narrative-driven investing.
Chapter 4 - Innovation Stack Shockwaves: When Everything Moves Together
This chapter is where our method stops being a single-company microscope and becomes a wide-angle lens.
Until now we followed protagonists, Apple on a stage, NVIDIA in the datacenter, Tesla in the spotlight. In this chapter, the protagonist is the whole industry. The camera pulls back.
When an innovation hits the innovation stack, it rarely stays inside one ticker. It spreads. Partners, suppliers, competitors, and the platforms that will be disrupted all move, sometimes in opposite directions. That is what makes this chapter different. We stop asking, “did one stock jump?” and start asking, “did the market move together?”
To measure that, we track a basket of the 25 largest, most liquid market-cap leaders across the innovation stack around the same milestone dates and look at two signals:
- the sector average return over the event window
- the Winner Ratio, how many of the 25 finish the window positive
Meta LLaMA Release (February 24, 2023): Open Source as a Shockwave
LLaMA is a reminder that not every turning point is a product you can buy. Sometimes it is a capability that becomes broadly accessible. By pushing frontier-grade models into the open-source ecosystem, LLaMA changed developer expectations and accelerated demand for training, inference, and tooling across the stack.
- Winner Ratio: 92%
- Sector average 30-day return: +10.30%
That is what an open-source shockwave looks like on a price chart: +10.30% on average, with 92% of the basket positive.
Vision Pro Announcement (June 5, 2023): A New Interface, a Big Question Mark
Vision Pro is the rare product launch that tries to create a new category. Markets like categories, but only when they turn into ecosystems. The early footprint here is less about day 0 hype and more about whether the stack believes spatial computing becomes a platform, or stays a premium niche.
- Winner Ratio: 83%
- Sector average 30-day return: +10.67%
Even with all the “VR has failed before” skepticism baked in, the stack leans in: +10.67% on average, and 83% of names end the window up.
Innovation Stack Summary: Twelve Events, One Map
| Event | Date | Sector Return | Winner Ratio |
|---|---|---|---|
| Amazon S3 | Mar 2006 | +4.77% | 65% |
| ASML EUV | Aug 2006 | +8.93% | 88% |
| iPhone | Jun 2007 | -0.30% | 59% |
| Chrome | Sep 2008 | -24.72% | 6% |
| Azure | Feb 2010 | +8.77% | 89% |
| Touch ID | Sep 2013 | +2.70% | 71% |
| TensorFlow | Nov 2015 | +1.42% | 64% |
| Armv9 | Mar 2021 | -2.34% | 50% |
| LLaMA | Feb 2023 | +10.30% | 92% |
| GPT-4 | Mar 2023 | +3.17% | 63% |
| Copilot | Mar 2023 | +3.23% | 67% |
| Vision Pro | Jun 2023 | +10.67% | 83% |
Two final lenses make the “distributed footprint” concrete:
- Return range (best vs worst): the gap between the strongest and weakest names in the basket for each event. It shows how brutal the tails can be even when the average looks fine.
- Cross-sectional dispersion: how spread out returns are across the 25 companies. Higher dispersion means clearer winners and losers.
Now for the part everyone cares about: who actually captured the upside when the stack moved.
For each of the 12 stack-level events, we extracted the top 3 companies by 30-day cumulative return. The Sankey shows two views:
Top: Positive impact - companies that gained the most from each event
Bottom: Negative impact - companies that lost the most from each event
💡 Key insight: some tickers appear repeatedly as winners. NVDA shows up across multiple events, capturing disproportionate value from stack shifts. The negative panel reveals the other side: events like Chrome (2008) created more losers than winners as macro headwinds overwhelmed innovation.
The point of this chapter is not to crown a single winner. It is to show that when the stack is hit, the footprint is usually distributed, and often asymmetric.
Next, we leave the innovation stack and enter a domain where the rules are even stricter, healthcare, where a single approval can rewrite the future overnight.
Chapter 5 - Healthcare: The Power of Regulatory Moments

Healthcare innovations operate under different rules than anything in technology. A drug that shows promising results in trials might never help a single patient, until regulators say yes.
This creates something unique in markets: binary events with massive stakes. An FDA approval transforms “might work” into “will work” in a single moment. Billions of dollars in value can appear, or vanish, overnight.
The GLP-1 Revolution: A New Category Emerges
Perhaps no healthcare innovation has reshaped markets more dramatically than GLP-1 drugs for weight loss. Drugs like Wegovy, Mounjaro, and Zepbound didn’t just help diabetics manage blood sugar, they produced unprecedented weight loss in clinical trials.
The implications extend far beyond pharmaceuticals. Food companies must reconsider their futures. Weight Watchers restructured its entire business model. Fitness chains adjusted projections. Medical device makers serving obese patients reconsidered long-term demand.
Zepbound Obesity Launch (November 8, 2023):
- Sector average 30-day return: +7.73%
- Sector median 30-day return: +7.71%
The GLP-1 revolution creates clear footprints, not just for drug makers like Eli Lilly and Novo Nordisk, but for entire adjacent industries.
CRISPR Approval (December 8, 2023): Gene Editing Becomes Real
For decades, CRISPR existed in science fiction and research labs. The ability to edit genes precisely, to potentially cure genetic diseases at their source, seemed perpetually futuristic.
On December 8, 2023, the future arrived. The FDA approved Casgevy, the first CRISPR gene-editing therapy, for treating sickle cell disease. A technology that had won Nobel Prizes was now helping actual patients.
Sector average 30-day return: +6.37%
The market recognized CRISPR’s approval as transformative, not just for Vertex (which partnered on Casgevy) but for the entire biotechnology sector. Gene editing had crossed from possibility to reality.
Healthcare Event Summary
| Event | 30-Day Return | Type |
|---|---|---|
| mRNA Vaccine | +2.48% | Platform technology |
| Wegovy Launch | +4.10% | Drug launch |
| Paxlovid Launch | -2.26% | COVID treatment |
| Mounjaro Launch | -1.35% | Diabetes/obesity |
| Leqembi Approval | -3.33% | Alzheimer’s |
| Zepbound Launch | +7.73% | GLP-1 blockbuster |
| Casgevy CRISPR | +6.37% | Gene therapy |
| AlphaFold 2 | +5.51% | AI breakthrough |
| GPT-4 Medical | +8.02% | Medical AI |
| Da Vinci 5 | -3.54% | Surgical robotics |
Here's the fun part: approvals don't just move the innovator. They reshuffle the whole competitive map.
This Sankey ranks the top 3 companies by 30-day cumulative return after each of our 10 healthcare events, split into two panels:
Top: Positive impact, who benefited most from each approval
Bottom: Negative impact, who lost ground after each event
💡 Key insight: approvals don't just reward the innovator. The positive panel shows flows spreading to adjacent players positioned for the same therapeutic shift. The negative panel captures competitive casualties: when a breakthrough drug launches, rivals and incumbents often lose ground.
Act IV - The Four Archetypes of Market Recognition
After analyzing 45 innovation events across five domains, clear patterns emerge. Markets don’t recognize all innovations the same way. Instead, we found Four distinct archetypes of market response:
1. The Instant Footprint
Some innovations are recognized immediately and sustainably. The event-day return is strong and positive, and that strength continues through the 30-day window. The market sees the innovation, understands its value, and prices it accordingly.
Classic Examples:
- NVIDIA V100 Launch: +17.83% day-0, +30.71% over 30 days
- Healthcare regulatory approvals with clear commercial potential
- Infrastructure plays when demand is already visible
When it happens: Instant footprints appear when an innovation confirms what sophisticated investors already suspected. The V100 didn’t surprise anyone tracking AI research, it just provided the hardware that everyone knew was needed. The market was primed to price it immediately.
2. The Slow Burn
Other innovations are initially dismissed or ignored, only to be recognized weeks later. The event-day return is weak or negative, but by day 30, the cumulative return is strongly positive. The market misses the significance at first, then gradually catches on.
Classic Examples:
- Apple iPod: -4.63% day-0, +30.98% over 30 days
- Apple M1 Chip: -0.30% day-0, +12.93% over 30 days
- NVIDIA CUDA: -2.64% day-0, years of delayed recognition
When it happens: Slow burns appear when an innovation is too different to understand immediately. The iPod wasn’t just a better MP3 player, it was the beginning of Apple’s transformation into a consumer electronics company. CUDA wasn’t just faster graphics, it was the foundation of modern AI. These implications take time to become clear.
3. The Mirage
Some events create immediate excitement that fades away. Strong initial reaction that reverses over the following weeks, leaving little or negative cumulative return. The market overreacts to spectacle or hype.
Classic Examples:
- Tesla Optimus Gen 2 Reveal: +0.96% day-0, -20.21% over 30 days
- Tesla Cybertruck Deliveries Begin: -1.66% day-0, -8.40% over 30 days
- Overhyped competitor announcements
When it happens: Mirages (False Starts) appear when expectations exceed reality, or when an event is more show than substance. Tesla events are particularly prone to mirages because they blend genuine innovation with theatrical presentation. The spectacle creates immediate attention, but sustained analysis reveals less than advertised.
Archetype Distribution
Of 24 single-company events analyzed:
- Instant Winners (+day, +30d): 46% (11)
- Slow Burns (-day, +30d): 38% (9), the most fascinating finding.
- False Starts (+day, -30d): 8% (2)
- Double Losers (-day, -30d): 8% (2)
This figure brings the full story together. Imagine a map of market recognition: each dot is an innovation event, the x-axis is the headline reaction on day 0, and the y-axis is the verdict 30 trading days later.
That simple setup creates four quadrants: four ways the market can process the exact same kind of “big announcement.”
- Instant Winners (Q1): positive immediately and still positive by day 30
- Slow Burns (Q2 🔥): negative on day 0, but positive by day 30
- False Starts (Q4): positive on day 0, then fade below zero by day 30
- Double Losers (Q3): negative on day 0 and still negative by day 30
The dashed trend line and R^2 = 0.05 make the point bluntly: day-0 moves explain almost none of the 30-day outcomes. The real “recognition” signal shows up in the weeks after the announcement, not the hours after the headline.
The bar chart on the right quantifies how often each archetype appears across our 24 single-company events:
| Archetype | Share | Count |
|---|---|---|
| Instant Winners | 46% | 11 |
| Slow Burns 🔥 | 38% | 9 |
| False Starts | 8% | 2 |
| Double Losers | 8% | 2 |
💡 Key insight: The most fascinating finding is the Slow Burn quadrant: 38% of events start negative on day 0, but still finish the month positive. In fact, only 8% of innovations are “true failures” - 84% end up positive over 30 days. These are the moments patient investors could have captured while others panicked over the first print.
Act V - Building the Innovation Signature Framework
Patterns are interesting. But can we turn them into something actionable? Can we quantify what makes an innovation truly transformative versus merely hyped?
Based on our pattern analysis, we built an Innovation Signature Score framework - a systematic way to measure how strongly the market recognized any given innovation.
From Patterns to Predictors
Before building the score, we needed to identify which signals actually matter. Our correlation analysis revealed the answer.
The striking finding: Event Day Return and 30-Day Return have only r = 0.22 correlation. The market’s immediate reaction has almost no predictive power for sustained performance. Event day is theater. The 30-day window is where recognition actually happens.
But one relationship stood out: successful innovations decrease volatility (r = -0.25). True breakthroughs don’t just move prices - they resolve uncertainty.
The Four Archetypes
Across our 24 single-company events, most innovations end up positive over 30 days. That is where the plot gets fascinating: the market recognizes innovation far more often than the day-0 headline would make you believe.
| Archetype | Share | Description |
|---|---|---|
| Instant Winners | 46% | Positive on day 0, positive at day 30 |
| Slow Burns 🔥 | 38% | Negative on day 0, positive at day 30 |
| False Starts | 8% | Positive on day 0, negative at day 30 |
| Double Losers | 8% | Negative on both |
The standout result is how rare “true failures” are. Only 8% land negative on both day 0 and day 30. For most events, the market does recognize the innovation. The only question is timing: does recognition arrive instantly, or does it show up after an early phase of doubt?
The most fascinating finding lives in the Slow Burn bucket. Selling on a bad day-0 reaction can mean missing the move that comes next, because nearly four in ten innovations start with skepticism and still finish the month in the green.
💡 Key insight: Only 8% of innovations are “true failures.” A remarkable 84% of innovations end up with positive 30-day returns. The question is when the market recognizes them.
The Volatility Signature
One of our most counterintuitive discoveries: successful innovations REDUCE post-event volatility.
| Outcome | Pre-Event Vol | Post-Event Vol | Change |
|---|---|---|---|
| Positive 30d Return | 2.38% | 2.26% | -0.12% |
| Negative 30d Return | 2.74% | 3.06% | +0.32% |
Interpretation: True innovations resolve uncertainty. Before an announcement, the market doesn’t know what to expect. After a successful innovation, price discovery occurs - investors converge on a valuation, and volatility decreases.
The Innovation Signature Score Formula
We synthesized these patterns into a single composite metric with five components:
Component 1: Return Magnitude (0-30 points)
The 30-day cumulative return, capped to prevent outliers from dominating. Big returns suggest the market eventually recognized value.
Component 2: Positive Return Bonus (20 points)
If the 30-day return is positive, add 20 points. Direction matters more than magnitude - being positive signals success.
Component 3: Momentum Sustained (15 points)
If the 30-day return exceeds the event-day return, add 15 points. This captures the Slow Burn pattern - innovations that build momentum over time.
Component 4: Volatility Stabilization (0-10 points)
If post-event volatility is lower than pre-event volatility, add points. True innovations resolve uncertainty - the market figures out what something is worth.
Component 5: Volume Conviction (0-10 points)
If trading volume increased by more than 20%, add 10 points. Sustained attention suggests genuine interest rather than noise.
Innovation Categories
| Score | Category | Interpretation |
|---|---|---|
| >=60 | 🌟 Transformative | Clear, sustained market recognition |
| 40-59 | ✅ Strong Innovation | Solid recognition with some uncertainty |
| 20-39 | 🔶 Moderate | Mixed signals, partial recognition |
| <20 | ❌ Weak/Negative | Market rejected or ignored |
Top Innovations by Score
🌟 Transformative (Score >=60):
| Event | Company | Score | 30-Day Return |
|---|---|---|---|
| Cybertruck Reveal | Tesla | 80 | +32.19% |
| Tesla V100 Launch | NVIDIA | 75 | +30.71% |
| iPod Launch | Apple | 75 | +30.98% |
| DGX-1 Launch | NVIDIA | 64 | +18.27% |
| A100 Ampere Launch | NVIDIA | 64 | +14.05% |
| RTX 2080 Ti Launch | NVIDIA | 61 | +15.65% |
| Tesla Bot Announcement | Tesla | 60 | +15.11% |
The key insight: The iPod (-4.6% on day 0) scores as highly as the hyped Cybertruck reveal (+0.7% on day 0). Our framework captures both immediate blockbusters and slow-burn transformations - because it rewards sustained momentum, not initial hype.
Act VI - Validation: Does It Actually Work?
A framework is only valuable if it works on data it wasn’t trained on. We tested on 13 out-of-sample events - different companies, different industries, different time periods.
The Test Events
| Category | Events |
|---|---|
| AI/ML | AlphaGo, Microsoft OpenAI $10B, Meta Llama 2, Google Gemini |
| Cloud/Dev Tools | AWS Lambda, GitHub Copilot GA |
| Biotech | Moderna mRNA 94.5%, CRISPR Casgevy, AlphaFold 2 |
| Consumer | Netflix Streaming, Amazon Echo/Alexa |
| Other | Adobe Firefly, Bitcoin ETF |
The Results
| Event | Score | Category | 30-Day Return |
|---|---|---|---|
| Moderna mRNA 94.5% | 58 | ✅ Strong | +13.5% |
| Google Gemini | 57 | ✅ Strong | +12.3% |
| GitHub Copilot GA | 56 | ✅ Strong | +11.3% |
| Microsoft OpenAI $10B | 55 | ✅ Strong | +5.0% |
| Bitcoin ETF | 45 | ✅ Strong | +3.8% |
| AlphaFold 2 | 25 | 🔶 Moderate | -0.4% |
| Netflix Streaming | 19 | ❌ Weak | -0.9% |
| AlphaGo | 6 | ❌ Weak | -3.9% |
| Meta Llama 2 | -4 | ❌ Weak | -4.5% |
Does Score Predict Returns?
| Group | N | Avg 30-Day Return |
|---|---|---|
| High Score (>=40) | 5 | +9.2% |
| Low Score (<40) | 8 | -1.9% |
| Separation | +11.1 percentage points |
The framework works. High-scoring events averaged +9.2% returns. Low-scoring events averaged -1.9%. The model successfully identified the category for 11 of 13 test events.
Visualizing the Test Events
Plotting the ±30 day cumulative return windows reveals how differently the market processes each innovation:
- High scorers (Moderna, Copilot, Gemini) show steady upward trajectories - conviction building over time
- Low scorers (AlphaGo, Llama 2) flatline or drift negative - the market never found a reason to reprice
The average curve across all test events mirrors what we saw in training: a slight dip around event day (uncertainty), followed by gradual separation as winners pull away from losers.
Case Studies: What the Framework Reveals
✅ Moderna mRNA (Score: 58) - Efficacy data eliminated uncertainty. Volatility dropped. Momentum sustained. Framework correctly identified Strong Innovation.
✅ GitHub Copilot GA (Score: 56) - When AI-assisted coding went mainstream in June 2022, our framework flagged it as Strong Innovation. The 30-day return (+11.3%) confirmed it. This wasn’t hype - it was a real product shipping to real developers.
❌ AlphaGo (Score: 6) - Arguably the most important AI milestone of the decade. But it was a research demonstration, not a product. No revenue, no commercial application. The market shrugged.
This validates our logic: the framework measures market recognition, not historical importance. Some innovations matter enormously for technology’s arc while leaving no immediate stock footprint.
❌ Netflix Streaming (Score: 19) - We know now it was the beginning of the streaming revolution. In 2007? The market didn’t care. The ultimate slow-burn - too slow for even our 30-day window.
Test Your Own Innovation
We packaged everything into an interactive dashboard. Enter any ticker and date - the system fetches real data from Yahoo Finance and calculates the Innovation Score with full breakdown.
The next time a major innovation is announced, you can run it through the framework and get an objective assessment of market recognition.
What We Built
From 46 training events + 13 test events, we constructed and validated a quantitative framework:
The Innovation Signature Score:
- Synthesizes return magnitude, momentum, volatility, and volume
- Successfully separates transformative innovations from noise
- Works across companies, industries, and time periods
The Core Insight: Event day reactions are noise. Sustained patterns are signal.
The Three Archetypes:
- Instant Winners - Immediate and sustained recognition
- Slow Burns - Initial doubt, then gradual acceptance
- False Starts - Early hype, fading conviction
Markets don’t see the future perfectly. But they leave footprints - traces that a careful analyst can learn to read. We built a framework for reading them.
Conclusion, What the Market Really Prices
We started with a question: when history happens, does the market react right away, or only once everyone knows it was history? After analyzing 45 innovations across 50+ companies, we found the answer depends entirely on context.
It depends.
The Five Laws of Innovation Footprints
1. Compute infrastructure is priced early, but only when demand is visible.
NVIDIA’s V100 produced instant footprints because AI demand was already growing. CUDA produced almost nothing, because in 2007, no one knew what to do with it.
2. Consumer products are priced slowly, even when everyone is watching.
The iPhone, iPod, and AirPods all faced skepticism on launch day. Consumer adoption takes time to prove itself.
3. Healthcare innovations depend on binary regulatory gates.
FDA approvals create clear footprints. When regulators say yes, uncertainty collapses instantly.
4. AI shocks move whole ecosystems, not individual stocks.
ChatGPT reshaped the valuation of every AI-adjacent company. The “winner ratio” is the best measure of transformative AI events.
5. Hype and substance produce different patterns.
Tesla events show that spectacle can create short-term volatility without sustained recognition.
The Final Insight
Compute infrastructure gets priced early when demand is visible. Consumer products get priced slowly, even when the whole world is watching. Healthcare innovations produce the cleanest footprints because regulatory approval collapses uncertainty overnight. AI shocks move entire ecosystems at once, not individual stocks. And spectacle without substance creates mirages that fade when reality arrives.
The Innovation Signature Score framework we built captures these patterns in a single metric. It rewards sustained momentum over initial hype and separates transformative innovations from noise. High-scoring events averaged +9.2% returns. Low-scoring events averaged -1.9%. The separation is real.
Markets are not oracles. They do not see the future clearly. But they leave footprints. Some are instant. Some build slowly. Some are illusions. The key is learning to read them.
Some futures are priced in hours. Others take quarters. And some are never priced at the moment you’d expect.
Thank You for Reading
| Team: SwissDataExplorers2025 | Course: Applied Data Analysis, EPFL |
Data Sources: Kaggle Stock Market Dataset (1962-2020), Yahoo Finance (2020-2024 extension), Official company newsrooms